


Recently, I have been exploring ways to make systems as monitorable as possible, which means minimizing the number of unknown-unknowns!
The four pillars of the Observability Engineering team’s charter are :
(Source: Twitter’s tech blog )
Monitoring
Alerting/visualization
Distributed systems tracing infrastructure
Log aggregation/analytics
Monitoring an application’s health and metrics makes it possible to manage it in a better way and notice unoptimized behavior. I will be giving you a walkthrough on monitoring and visualizing metrics of a Java application in this blog. We will be using the following tools to achieve this:
Micrometer: Exposes the metrics from our application
Prometheus: Stores our metric data
Grafana: Visualizes our data in graphs
It’s straightforward to implement all of them with just a few lines of code. We will be performing this on my project, which is a simple KV (key-value) store web service that has been developed in Java. You can find the code here. To make things even easier, we’ll be using Docker to run Prometheus and Grafana. Later we will provision Grafana Data Sources and Dashboards from the configuration. Let’s get started!
Configuring Java application with Micrometer
Adding Prometheus support to any Java application becomes a lot easier with Micrometer. It provides a clean facade to many monitoring platforms, including Prometheus.
Installing
We need to add the following dependency :
In Gradle:
compile 'io.micrometer:micrometer-registry-prometheus:latest.release'
Configuring
In Micrometer, we need a “Meter,” which is the interface for collecting a set of measurements (which we individually call metrics) about our application.
PrometheusMeterRegistry prometheusRegistry = new PrometheusMeterRegistry(PrometheusConfig.DEFAULT);
Micrometer packs several Meter primitives including: Timer, Counter, Gauge, DistributionSummary, LongTaskTimer, FunctionCounter, FunctionTimerand and TimeGauge. We will be modifying our code to report various metrics using the above set of meters. You can read more about them from the official documentation. For instance, the following code defines a counter that can be used to count some events over a short window. Here this counter is used to count the number of getAll requests.
Counter getAllRequestCounter= prometheusRegistry.counter("http.request",
"uri", "/keyvalue",
"operation", "getAll");
Secondly, and most importantly, Prometheus expects to scrape app instances for metrics. In addition to creating a Prometheus registry, we will also need to expose an HTTP endpoint to Prometheus’ scraper. get(“/metrics”, (request, response) -> prometheusRegistry.scrape());
Note: The above configuration is for Spark Framework in Java. In a Spring environment, a Prometheus actuator endpoint is autoconfigured in the presence of the Spring Boot Actuator. To record an event, we call the increment method on the counter that we just created :
get("/keyvalue", (request, response) -> {    getAllRequestCounter.increment();   response.type("application/json");return new Gson().toJson(keyValueStoreService.getAll());
});
After we are done with configuring our code, let’s proceed towards setting up graphs.
Setting up Prometheus and Grafana
Prometheus is a time-series database that stores our metric data by pulling it using a built-in data scraper periodically over HTTP. It also has a simple user interface where we can query and visualize the collected metrics.
While Prometheus provides some basic visualization, Grafana offers a rich UI where you can build custom graphs quickly and create a dashboard out of many graphs in no time. Grafana can pull data from various data sources like Prometheus, Elasticsearch, InfluxDB, etc. Here we build docker-compose.yml to install Prometheus and Grafana from Docker:
version: "3"

services:
  app:
    build: .
    ports:
      - 4567:4567
  prometheus:
    image: prom/prometheus
    ports:
      - 9090:9090
    volumes:
      - "./prometheus/prometheus.yml:/etc/prometheus/prometheus.yml"
  grafana:
    image: grafana/grafana:latest
    ports:
      - 3000:3000
    depends_on:
      - prometheus
Let’s now configure Prometheus by setting the scrape interval, the targets, and define the endpoints. To do that, we’ll be using the prometheus.yml file:
global:
  scrape_interval: 5s

scrape_configs:
  - job_name: "prometheus"
    static_configs:
      - targets: ["localhost:9090"]
  - job_name: "key-value"
    static_configs:
      - targets: ['app:4567']
You can read more about Prometheus configurations, at the official documentation.
Bringing up everything
Run docker-compose up to start the app, Prometheus and Grafana. Open http://localhost:9090 for Prometheus and http://localhost:3000 for Grafana.
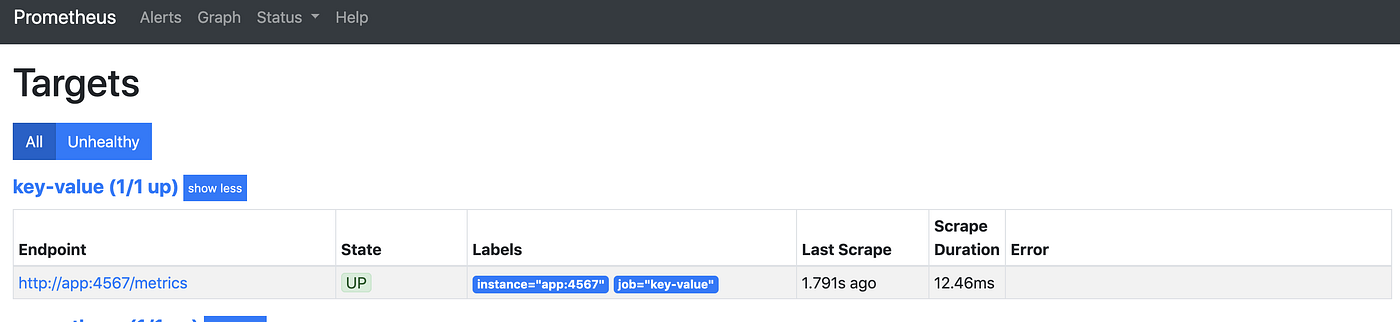
To check if Prometheus is pulling metrics from the web app, open “Status”> “Targets.”
Setting up Grafana
While docker-compose started Grafana, it doesn’t do much yet.
We need to configure Grafana to connect with Prometheus by manually setting up the data source.
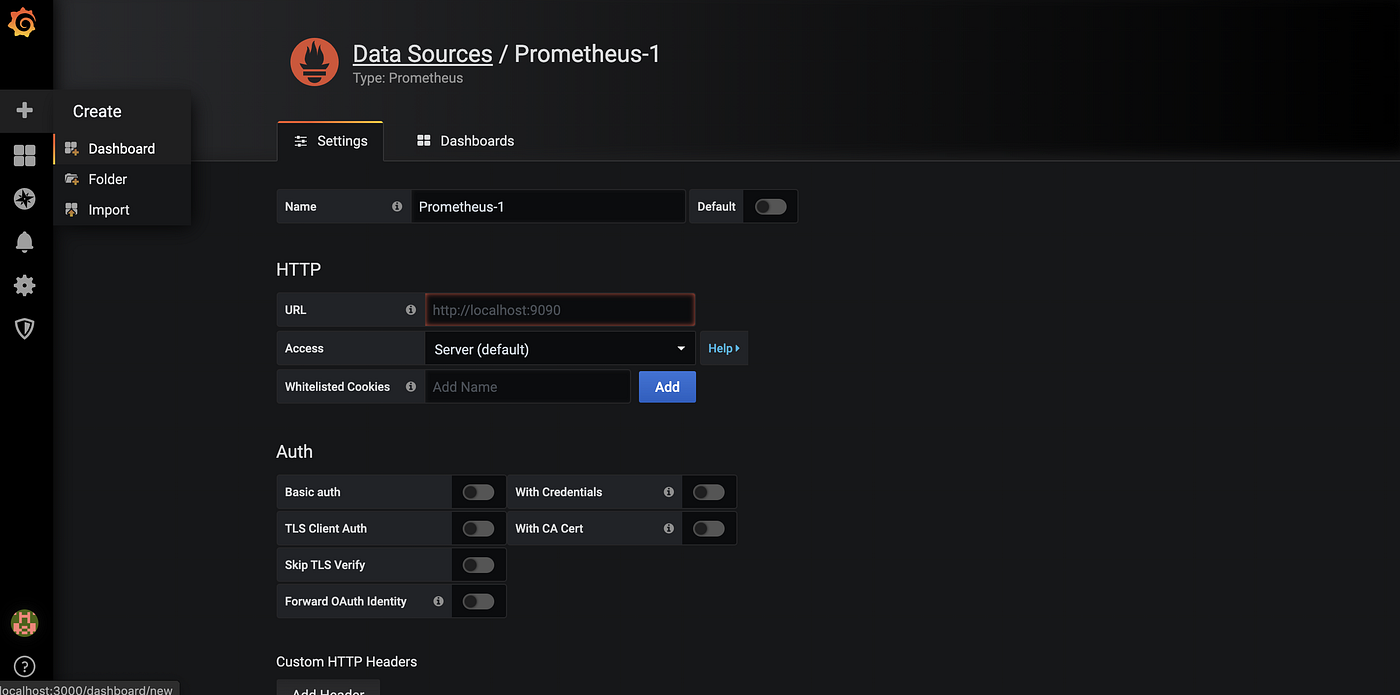
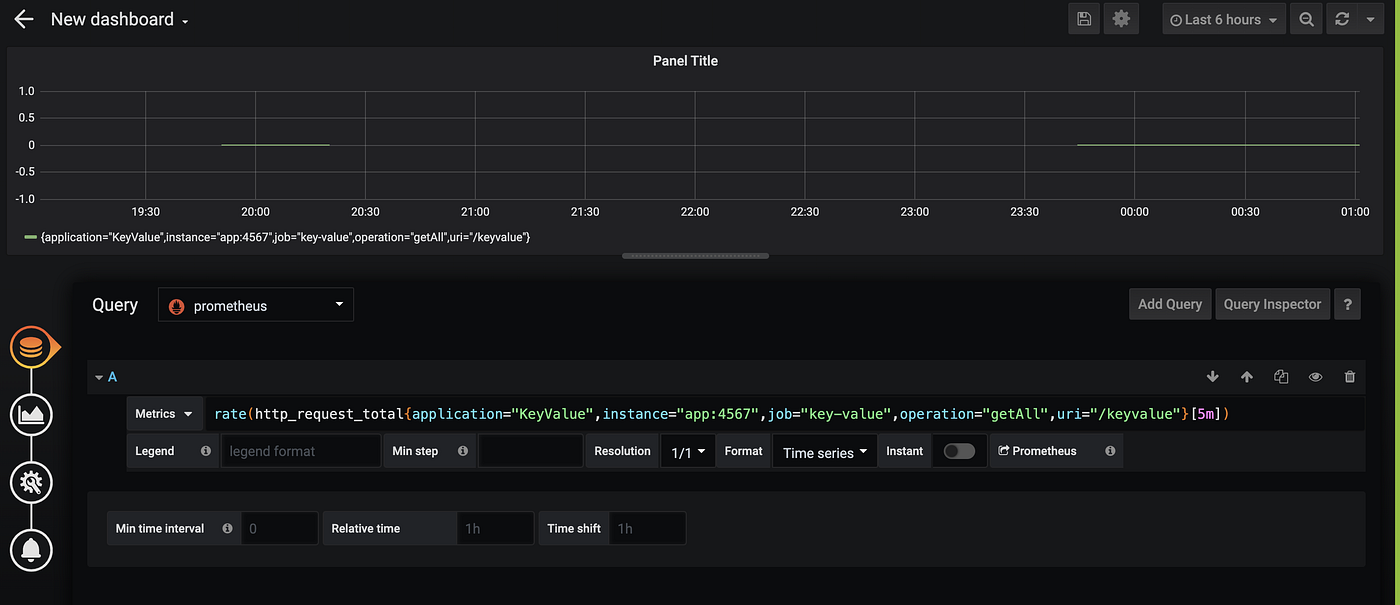
Then create a dashboard, add a “Query” and select your Prometheus data source, which you just configured.
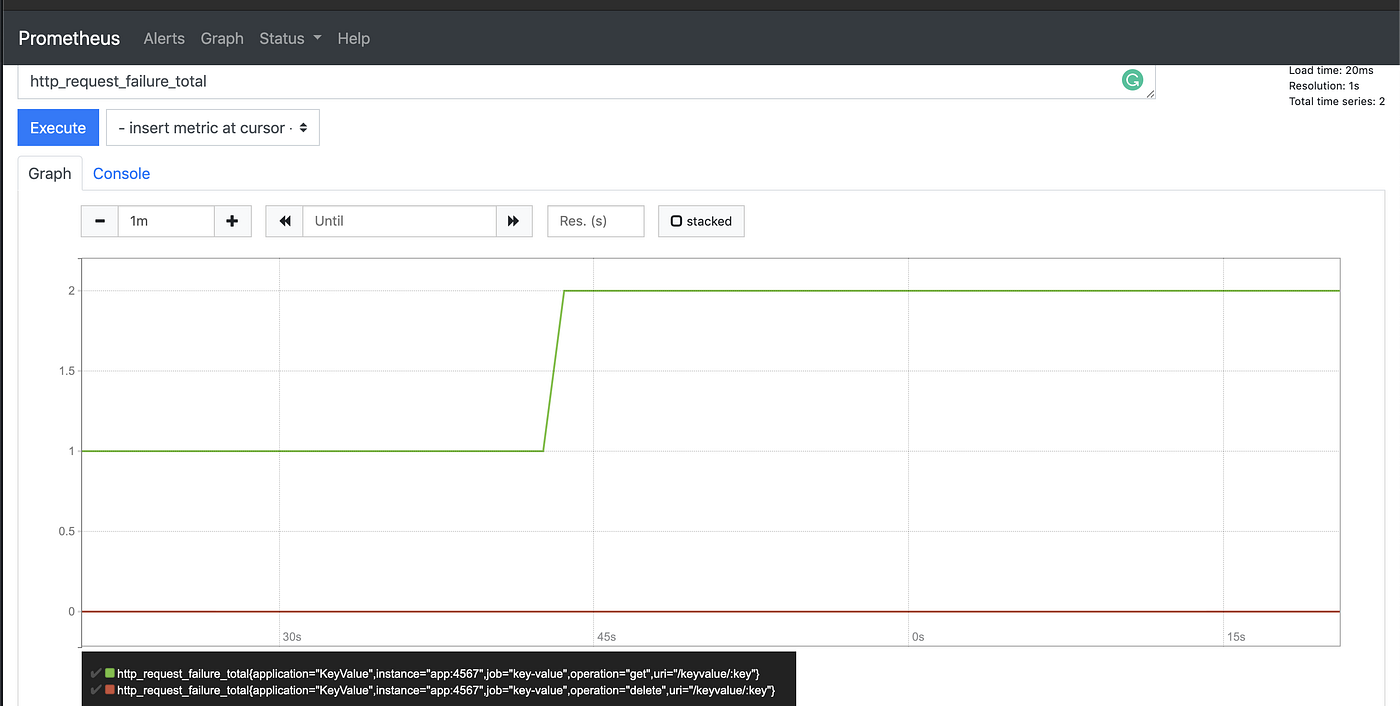
In the “Metrics” field, add a PromQL query such as:
http_request_total{application="KeyValue",instance="app:4567",job="key-value",operation="getAll",uri="/keyvalue"}
You can read more about PromQL in the official documentation.
Configure Grafana Provisioning
Instead of manually creating dashboards and data sources, we can utilize Grafana provisioning. You can read more about Grafana Provisioning in the official documentation. Add two new volumes to docker-compose to read our provisioning configs and dashboards. You can see the completed docker-compose file here. volumes:
"./grafana/provisioning:/etc/grafana/provisioning"2 - "./grafana/dashboards:/var/lib/grafana/dashboards"
Create a new file, datasource.yml under provisioning/datasources
apiVersion: 1

datasources:
  - version: 1
    name: prometheus
    type: prometheus
    access: proxy
    isDefault: true
    url: http://prometheus:9090
Create another file, dashboard.yml under provisioning/dashboards
apiVersion: 1

providers:
  - name: 'KeyValue'
    type: file
    options:
      path: /var/lib/grafana/dashboards
Export the dashboard you created earlier and put it under folder. You can find the dashboard here as well.
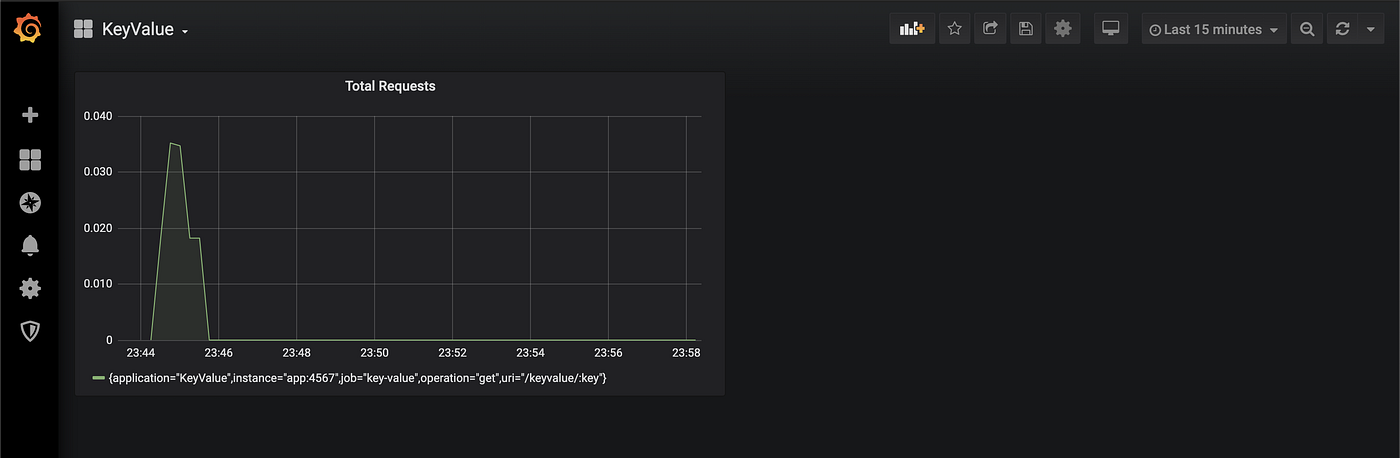
Bring docker-compose up, and you should be able to see Grafana with your dashboard and data source set.
Here we saw how to configure a Java application to monitor it with Prometheus. You can explore JMX exporter and Micrometer JVM extras to report several metrics about the JVM and many other java libraries. Let me know about your experiences in the comments!
Originally Posted at https://lambda.grofers.com/monitoring-java-web-apps-using-prometheus-and-grafana-49050f418bfc